![]()
測試環境為 CentOS 8 x86_64 虛擬機,資料庫為 MariaDB.
透過 Zabbix 的網頁就可以看到目前監控的 Agent 有哪些系統資訊可以查詢,除了透過 Zabbix 的網頁外,有辦法取得這些資料 (RAW Data) 嗎? 可以直接存取資料庫 – https://benjr.tw/103783 或是透過 API (下面介紹) 的方式.
關於安裝 Zabbix Server, Frontend, Agent 請參考以下連結.
- Zabbix Server, Frontend, Agent – https://benjr.tw/103709
- Agent – https://benjr.tw/103741
首先我們要來看有哪些資料可以查詢的, 在 Monitoring / Host 就可以看到建立好的 Zabbix Server 與 Agent.

點選 Monitoring / Latest Data 就可以看到有哪些資訊可以查詢.
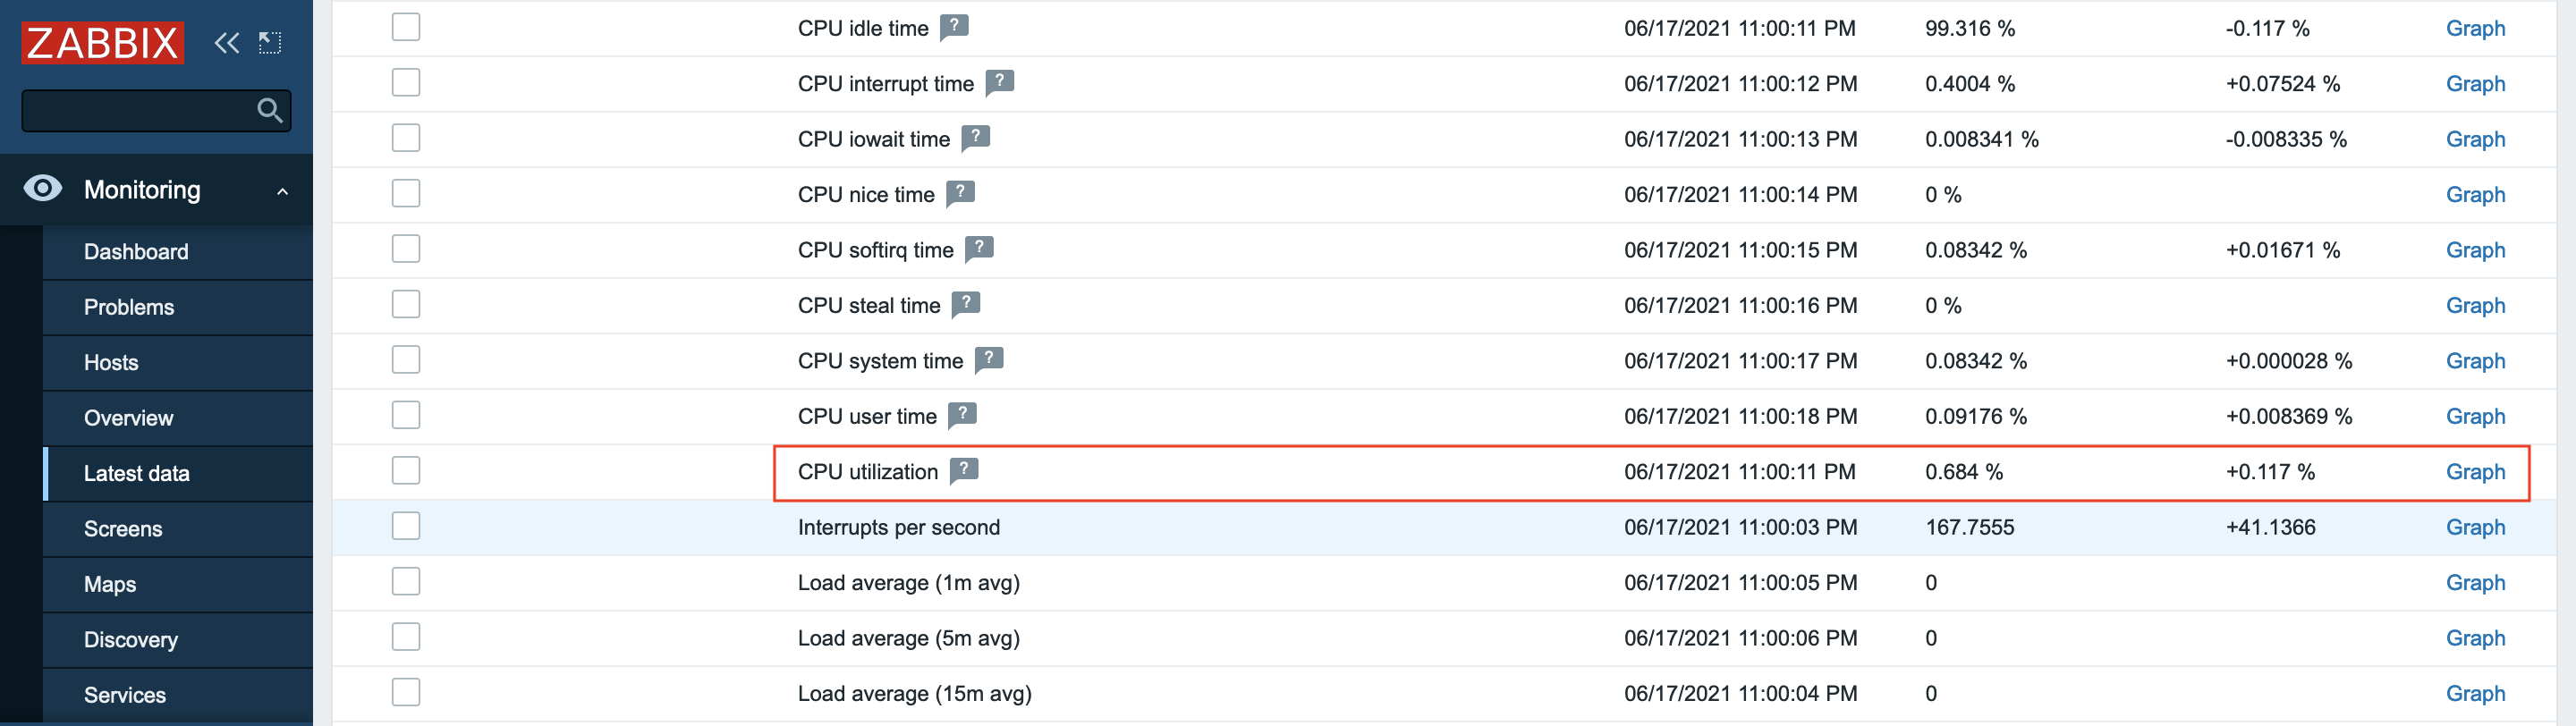
我要檢視 CentOS8-1 的 CPU utilization 要怎麼透過 API 來檢視資料, 參考文章 – https://www.zabbix.com/documentation/5.0/manual/api .
Authentication Token
首先要透過 user.login ( 關於這些 method 請參考 – https://www.zabbix.com/documentation/current/manual/api/reference ) 取得 Authentication Token .
{
    "jsonrpc": "2.0",
    "method": "user.login",
    "params": {
        "user": "Admin",
        "password": "zabbix"
    },
    "id": 1,
    "auth": null
}
參數說明:
- jsonrpc – the version of the JSON-RPC protocol used by the API; the Zabbix API implements JSON-RPC version 2.0;
- method – the API method being called;
- params – parameters that will be passed to the API method;
- id – an arbitrary identifier of the request;
- auth – a user authentication token; since we don’t have one yet, it’s set to null.
透過 curl (文字模式讀取 HTTP 資料),建議使用在 https 環境.
curl --header "Content-Type: application/json" \
--request POST \
--data '
{
    "jsonrpc": "2.0",
    "method": "user.login",
    "params": {
        "user": "Admin",
        "password": "zabbix"
    },
    "id": 1,
    "auth": null
}
' \
  "http://192.168.111.32/zabbix/api_jsonrpc.php"
執行結果
[root@localhost ~]# curl --header "Content-Type: application/json" \
> --request POST \
> --data '
> {
>     "jsonrpc": "2.0",
>     "method": "user.login",
>     "params": {
>         "user": "Admin",
>         "password": "zabbix"
>     },
>     "id": 1,
>     "auth": null
> }
> ' \
>   "http://192.168.111.32/zabbix/api_jsonrpc.php"
{"jsonrpc":"2.0","result":"cf9ab9d0cac7edc3231b6f75d7d71710","id":1}
List Host
第一步要先查詢 CentOS8-1 這一個 host 的 id 是多少,透過 host.get 搜尋 host 為 CentOS8-1 的 hostid .
{
    "jsonrpc": "2.0",
    "method": "host.get",
    "params": {
        "output": ["hostid", "host"],
        "filter": {
            "host": ["CentOS8-1"]
        }
        },
    "id": 2,
    "auth": "cf9ab9d0cac7edc3231b6f75d7d71710"
}
curl --header "Content-Type: application/json" \
--request POST \
--data '
{
    "jsonrpc": "2.0",
    "method": "host.get",
    "params": {
        "output": ["hostid", "host"],
        "filter": {
            "host": ["CentOS8-1"]
        }
        },
    "id": 2,
    "auth": "cf9ab9d0cac7edc3231b6f75d7d71710"
}
' \
  "http://192.168.111.32/zabbix/api_jsonrpc.php"
執行結果
[root@localhost ~]# curl --header "Content-Type: application/json" \
> --request POST \
> --data '
> {
>     "jsonrpc": "2.0",
>     "method": "host.get",
>     "params": {
>         "output": ["hostid", "host"],
>         "filter": {
>             "host": ["CentOS8-1"]
>         }
>         },
>     "id": 2,
>     "auth": "cf9ab9d0cac7edc3231b6f75d7d71710"
> }
> ' \
>   "http://192.168.111.32/zabbix/api_jsonrpc.php"
{"jsonrpc":"2.0","result":[{"hostid":"10385","host":"CentOS8-1"}],"id":2}
上面可以看到我的 CentOS8-1 hostid 是 10385 (後面會用到).
List itemid
接下來查看 CentOS8-1 的 CPU utilization itemid 是多少,這資訊可以透過 items.get 查詢 name 為 CPU utilization 而且 hostid 為 10385 (CentOS8-1) 的 itemid .
{
    "jsonrpc": "2.0",
    "method": "item.get",
    "params": {
        "output": ["itemid", "name"],
        "filter": {
            "name": ["CPU utilization"],
            "hostid": ["10385"]
        }
        },
    "id": 2,
    "auth": "cf9ab9d0cac7edc3231b6f75d7d71710"
}
curl --header "Content-Type: application/json" \
--request POST \
--data '
{
    "jsonrpc": "2.0",
    "method": "item.get",
    "params": {
        "output": ["itemid", "name"],
        "filter": {
            "name": ["CPU utilization"],
            "hostid": ["10385"]
        }
        },
    "id": 2,
    "auth": "cf9ab9d0cac7edc3231b6f75d7d71710"
}
' \
  "http://192.168.111.32/zabbix/api_jsonrpc.php"
執行結果
[root@localhost ~]# curl --header "Content-Type: application/json" \
> --request POST \
> --data '
> {
>     "jsonrpc": "2.0",
>     "method": "item.get",
>     "params": {
>         "output": ["itemid", "name"],
>         "filter": {
>             "name": ["CPU utilization"],
>             "hostid": ["10385"]
>         }
>         },
>     "id": 2,
>     "auth": "cf9ab9d0cac7edc3231b6f75d7d71710"
> }
> ' \
>   "http://192.168.111.32/zabbix/api_jsonrpc.php"
{"jsonrpc":"2.0","result":[{"itemid":"34535","name":"CPU utilization"}],"id":2}
上面可以看到 CPU utilization itemid 是 34535 (後面會用到).
List history
接下來透過 history.get 查詢 itemid 為 34535 ( CentOS8-1 的 CPU utilization 所使用的 ID) 的 itemid , clock , value 與 ns.
{
    "jsonrpc": "2.0",
    "method": "history.get",
    "params": {
        "output": "extend",
        "history": 0,
        "itemids": "34535",
        "sortfield": "clock",
        "sortorder": "DESC",
        "limit": 10
    },
    "id": 2,
    "auth": "cf9ab9d0cac7edc3231b6f75d7d71710"
}
curl --header "Content-Type: application/json" \
--request POST \
--data '
{
    "jsonrpc": "2.0",
    "method": "history.get",
    "params": {
        "output": "extend",
        "history": 0,
        "itemids": "34535",
        "sortfield": "clock",
        "sortorder": "DESC",
        "limit": 10
    },
    "id": 2,
    "auth": "cf9ab9d0cac7edc3231b6f75d7d71710"
}
' \
  "http://192.168.111.32/zabbix/api_jsonrpc.php"
執行結果
[root@localhost ~]# curl --header "Content-Type: application/json" \
> --request POST \
> --data '
> {
>     "jsonrpc": "2.0",
>     "method": "history.get",
>     "params": {
>         "output": "extend",
>         "history": 0,
>         "itemids": "34535",
>         "sortfield": "clock",
>         "sortorder": "DESC",
>         "limit": 10
>     },
>     "id": 2,
>     "auth": "cf9ab9d0cac7edc3231b6f75d7d71710"
> }
> ' \
>   "http://192.168.111.32/zabbix/api_jsonrpc.php"
{"jsonrpc":"2.0","result":[{"itemid":"34535","clock":"1624025591","value":"0.7008179999999982","ns":"536660278"},{"itemid":"34535","clock":"1624025531","value":"0.700642000000002","ns":"444277858"},{"itemid":"34535","clock":"1624025471","value":"0.6004999999999967","ns":"350232907"},{"itemid":"34535","clock":"1624025411","value":"0.6253130000000056","ns":"259558931"},{"itemid":"34535","clock":"1624025351","value":"0.6254689999999954","ns":"150847262"},{"itemid":"34535","clock":"1624025291","value":"0.6003999999999934","ns":"46943414"},{"itemid":"34535","clock":"1624025231","value":"0.7088059999999956","ns":"160703286"},{"itemid":"34535","clock":"1624025171","value":"0.6170269999999931","ns":"924693858"},{"itemid":"34535","clock":"1624025111","value":"0.6253650000000022","ns":"831777367"},{"itemid":"34535","clock":"1624025051","value":"0.5921110000000027","ns":"746609478"}],"id":2}
其中的 clock 回傳從 1970-01-0100:00:00 到指定的時間的秒數(無符號整數).