![]()
測試環境為 CentOS 8 x86_64 虛擬機.
安裝 Zabbix 來監控你的系統狀態,架構與服務如下.
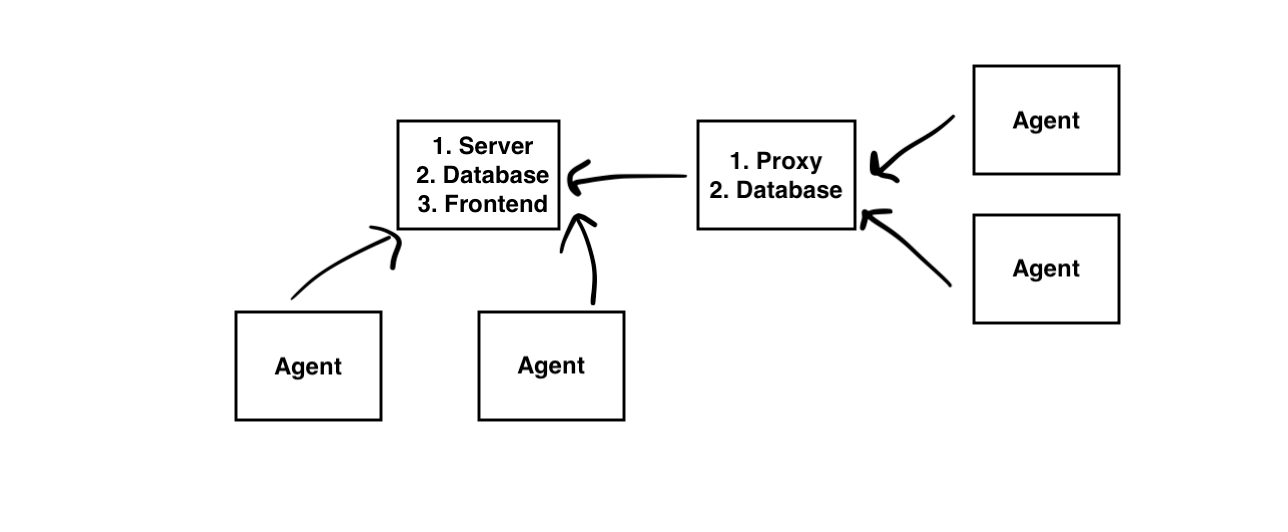
- Zabbix Server (需 Database 與 Front-end) – https://benjr.tw/103709
- Zabbix Proxy (Database) – https://benjr.tw/103805
Agent 無法直接連到 Server 時可以架設 Proxy . - Zabbix Agent
要監控的裝置只需安裝 Agent , Agent 有支援的作業系統如 Windows , Linux , macOS , AIX , FreeBSD , OpenBSD , Solaris ,下面介紹.
這邊只安裝 Zabbix agent ,事先需要安裝 Zabbix Server, Front-end ,請參考 – https://benjr.tw/103709
Agent 可以收集的資料以下.
- Network
Packets/bytes transferred, Errors/dropped packets, Collisions. - CPU
Load average , CPU idle/usage , CPU utilization data per individual process. - Memory
Free/used memory , Swap/pagefile utilization. - Disk
Space free/used , Read and write I/O. - Service
Process status , Process memory usage , Service status (ssh, ntp, ldap, smtp, ftp, http, pop, nntp, imap) , Windows service status, DNS resolution , TCP connectivity , TCP response time. - File
File size/time , File exists , Checksum , MD5 hash , RegExp search. - Log
Text log , Windows eventlog. - Other
System uptime , System time , Users connected , Performance counter (Windows).
我選擇的是 Zabbix version : 5.0 , OS Distribution : red_hat_enterprise_linux (CentOS) , OS Version : 8
Zabbix Agent
安裝 Zabbix Agent 所需套件, Zabbix 沒有在預設的 Repository ,需手動增加 zabbix Repository .
[root@localhost ~]# rpm -Uvh https://repo.zabbix.com/zabbix/5.0/rhel/8/x86_64/zabbix-release-5.0-1.el8.noarch.rpm
[root@localhost ~]# dnf -y install zabbix-agent
編輯 Zabbix Agent 設定檔案,目前我的 Zabbix server (Proxy) 與 Agent IP.
- Zabbix server (Proxy) – 192.168.111.32
- Zabbix Agent – 192.168.111.34
[root@localhost ~]# vi /etc/zabbix/zabbix_agentd.conf
Server=192.168.111.32
ServerActive=192.168.111.32
Hostname=CentOS8-2
說明:
這邊的 Server 與 ServerActive 可以為 Zabbix Server 或是 Zabbix Proxy.
其中 Server (Passive -polling) 與 ServerActive (Active checks – trapping , 還需指定 Hostname )他們的差別如下 ( 參考 – https://www.zabbix.com/zabbix_agent ).

圖片出自於 – https://blog.zabbix.com/zabbix-agent-active-vs-passive/
- Passive checks (polling):
- Zabbix server (or proxy) requests a value from Zabbix agent
- Agent processes the request and returns the value to Zabbix server (or proxy)
- Active checks (trapping):
- Zabbix agent requests from Zabbix server (or proxy) a list of active checks
- Agent sends the results in periodically
後續在 Template 可選擇 Template OS Linux by Zabbix agent 或是 Template OS Linux by Zabbix agent active (Active 沒成功過)

啟動 Zabbix 服務.
[root@localhost ~]# systemctl restart zabbix-agent
[root@localhost ~]# systemctl enable zabbix-agent
[root@localhost ~]# systemctl status zabbix-agent
Zabbix Web
在 Configuration / Hosts / Create Host 新增 Zabbix Agent .
主要是輸入 IP : 192.168.111.34 (也可以使用 DNS),這邊的 Host name 需與前面 Agent 設定檔 /etc/zabbix/zabbix_agentd.conf 裡的 Hostname=CentOS8-2 一致.
如果是透過 Proxy 時,需要在 Monitored by proxy 選擇指定的 proxy 名稱.
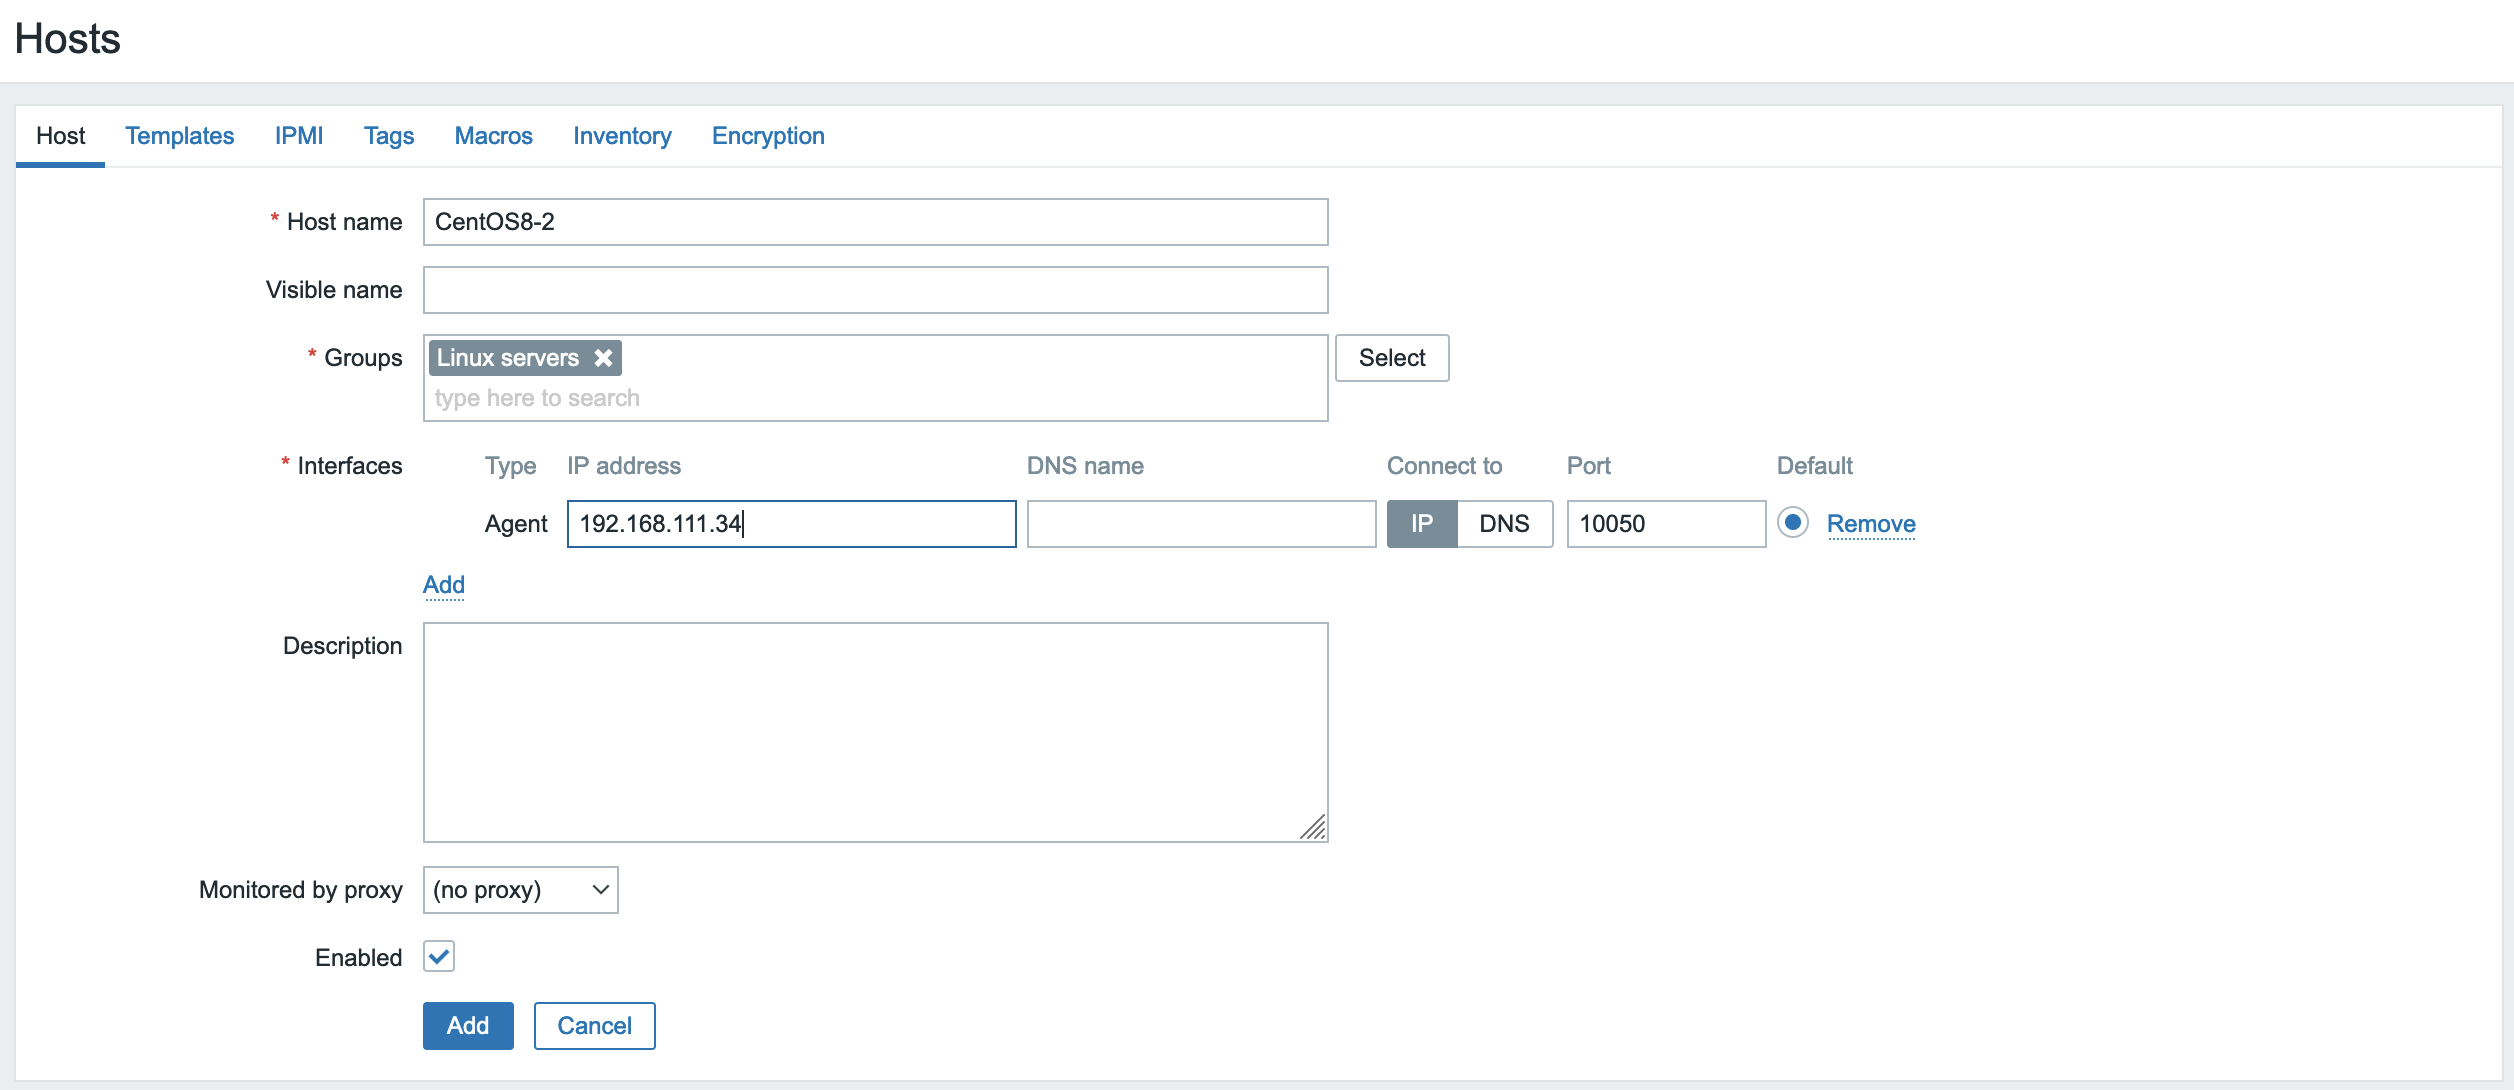
Templates (不同的 Template 會有不同監控 Monitor 與觸發 Trigger 警告的資料),這邊我選擇 Template OS Linux by Zabbix agent.

檢視 ZBX 顯示為綠色表示 Agent 與 Server (Agent) 之間的溝通是正確的.

回到 Monitoring / Host 就可以看到剛剛新增的 IP : CentOS8-2
